Gabrielė Oržekauskaitė
ux/ui designer
∅
web developer
∅
digital artist
>captivated by worlds and connections within
generating perspectives
assembling solutions</
Graphic design
A collection of design projects in various formats.
An editable flower pattern made inside Adobe Illustrator.
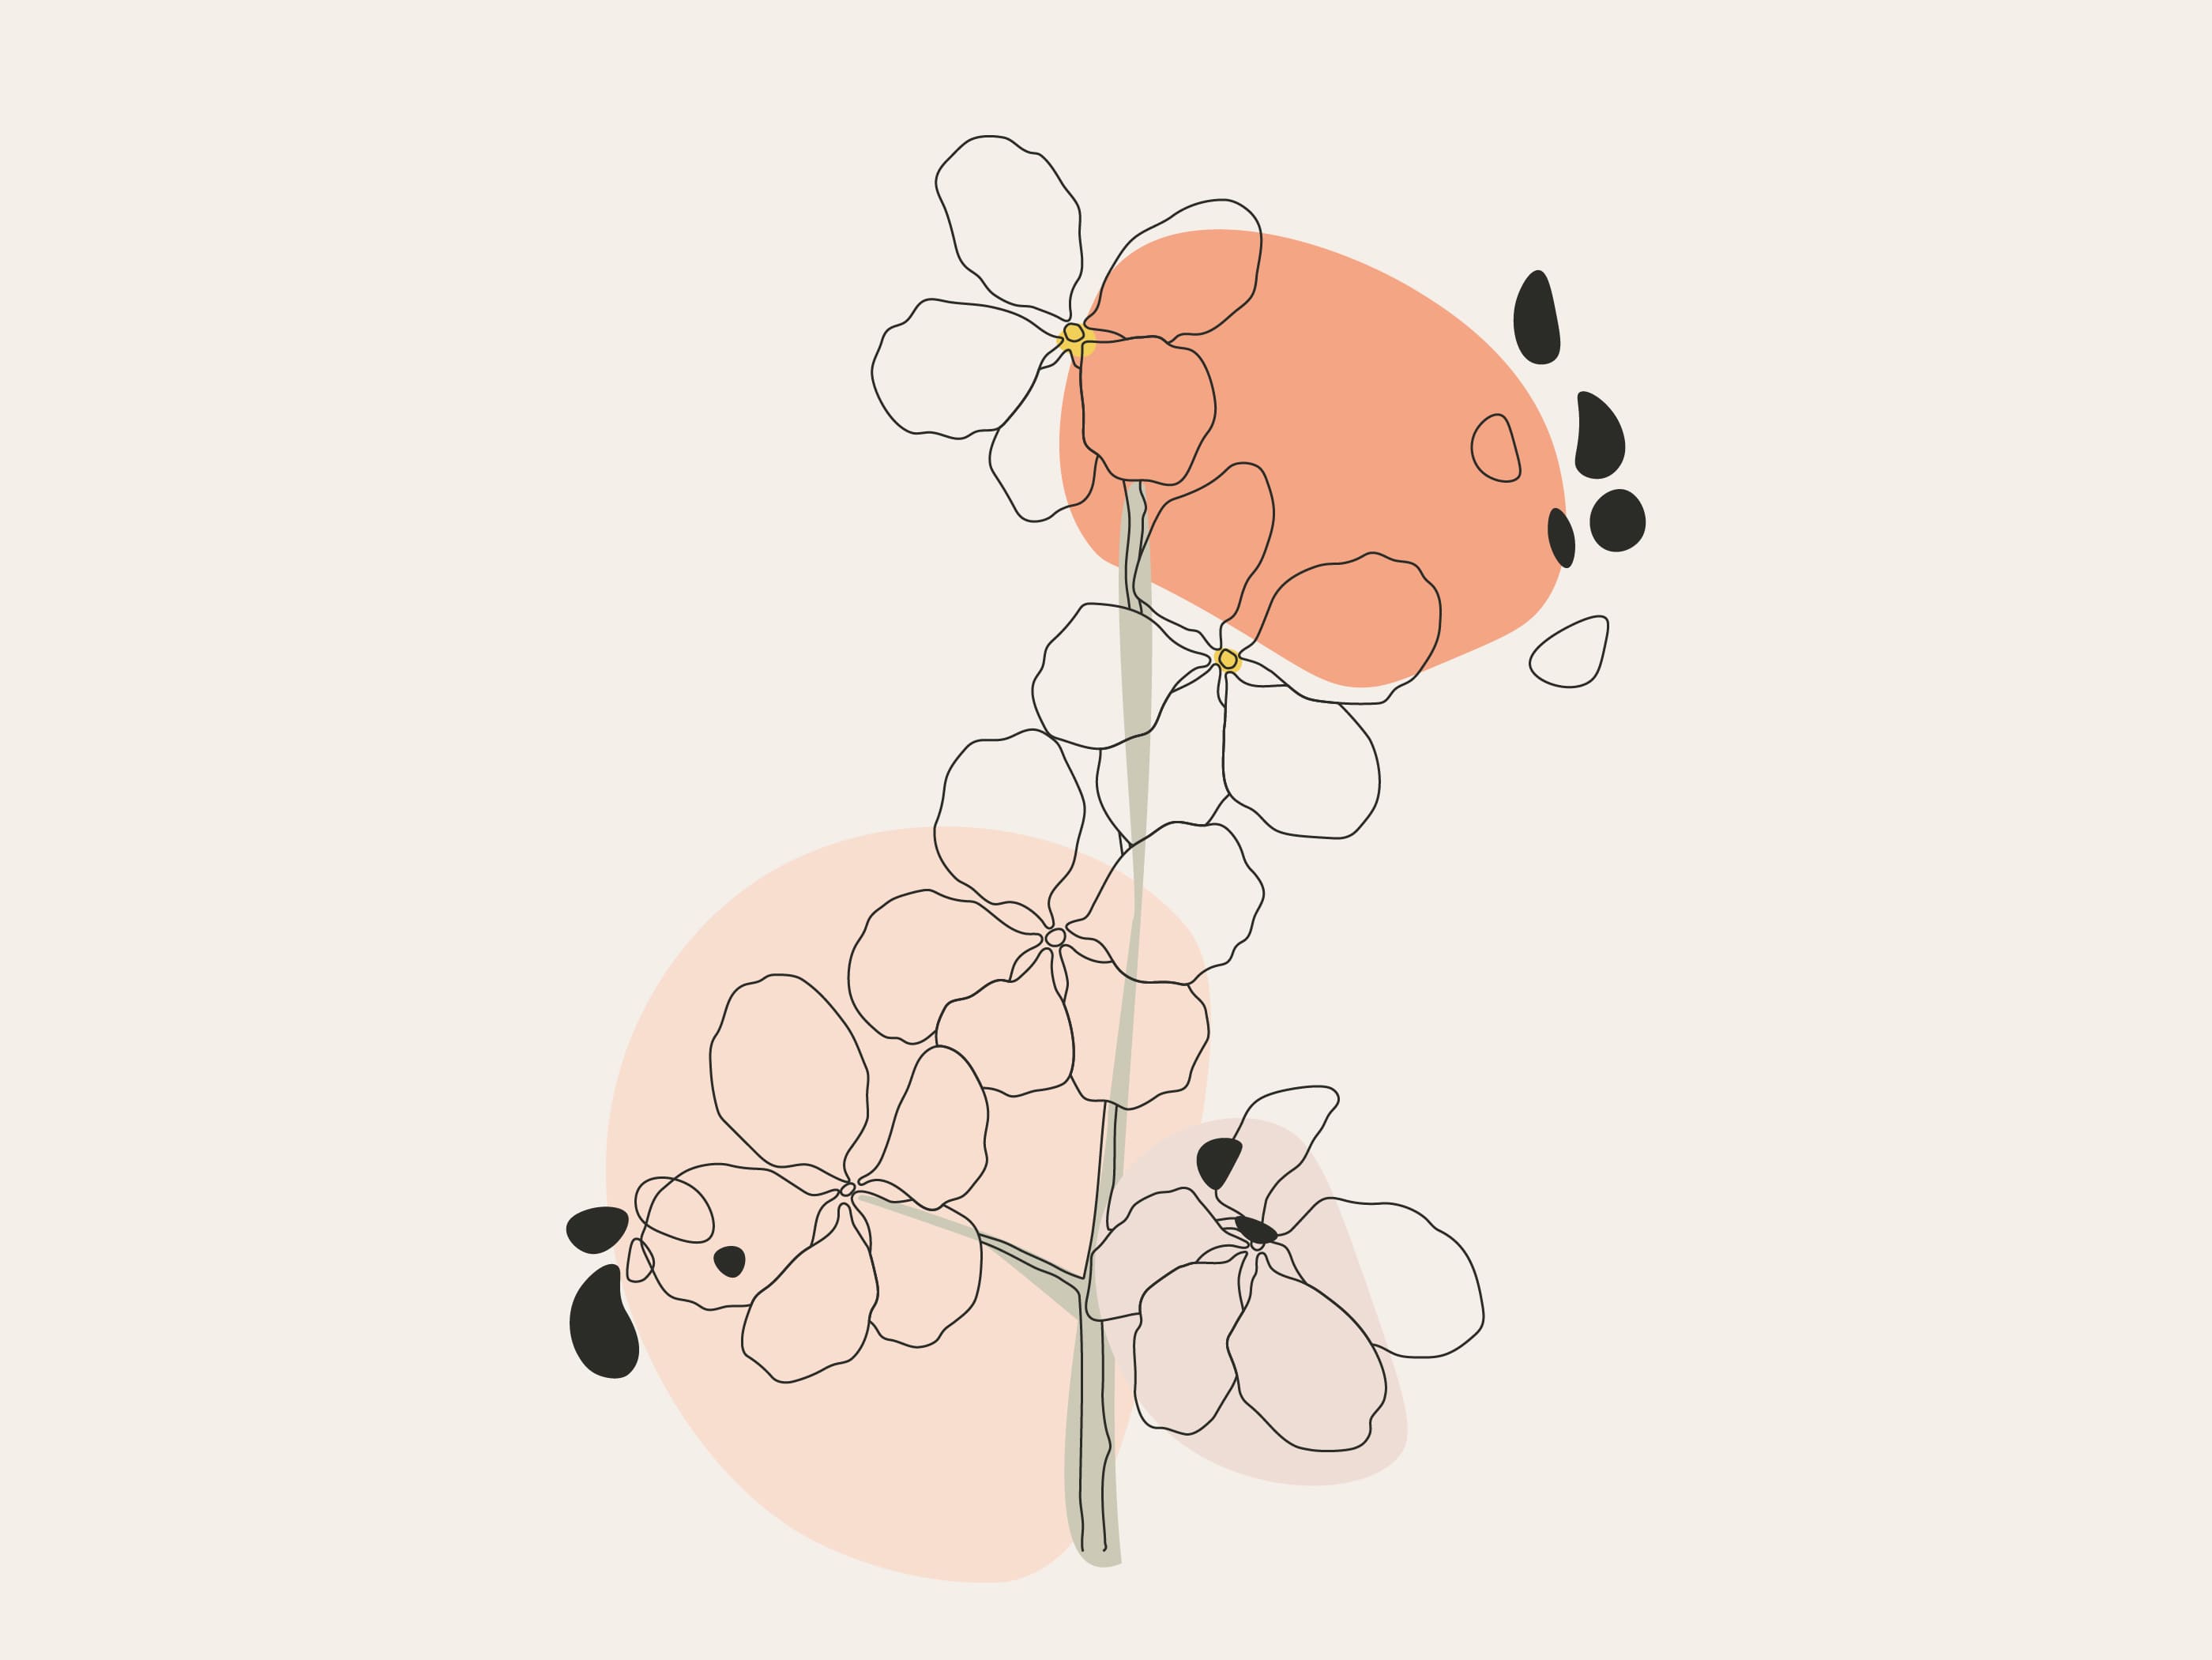
Vector flower illustration.

Visual communication sketch made inside Adobe Photoshop.
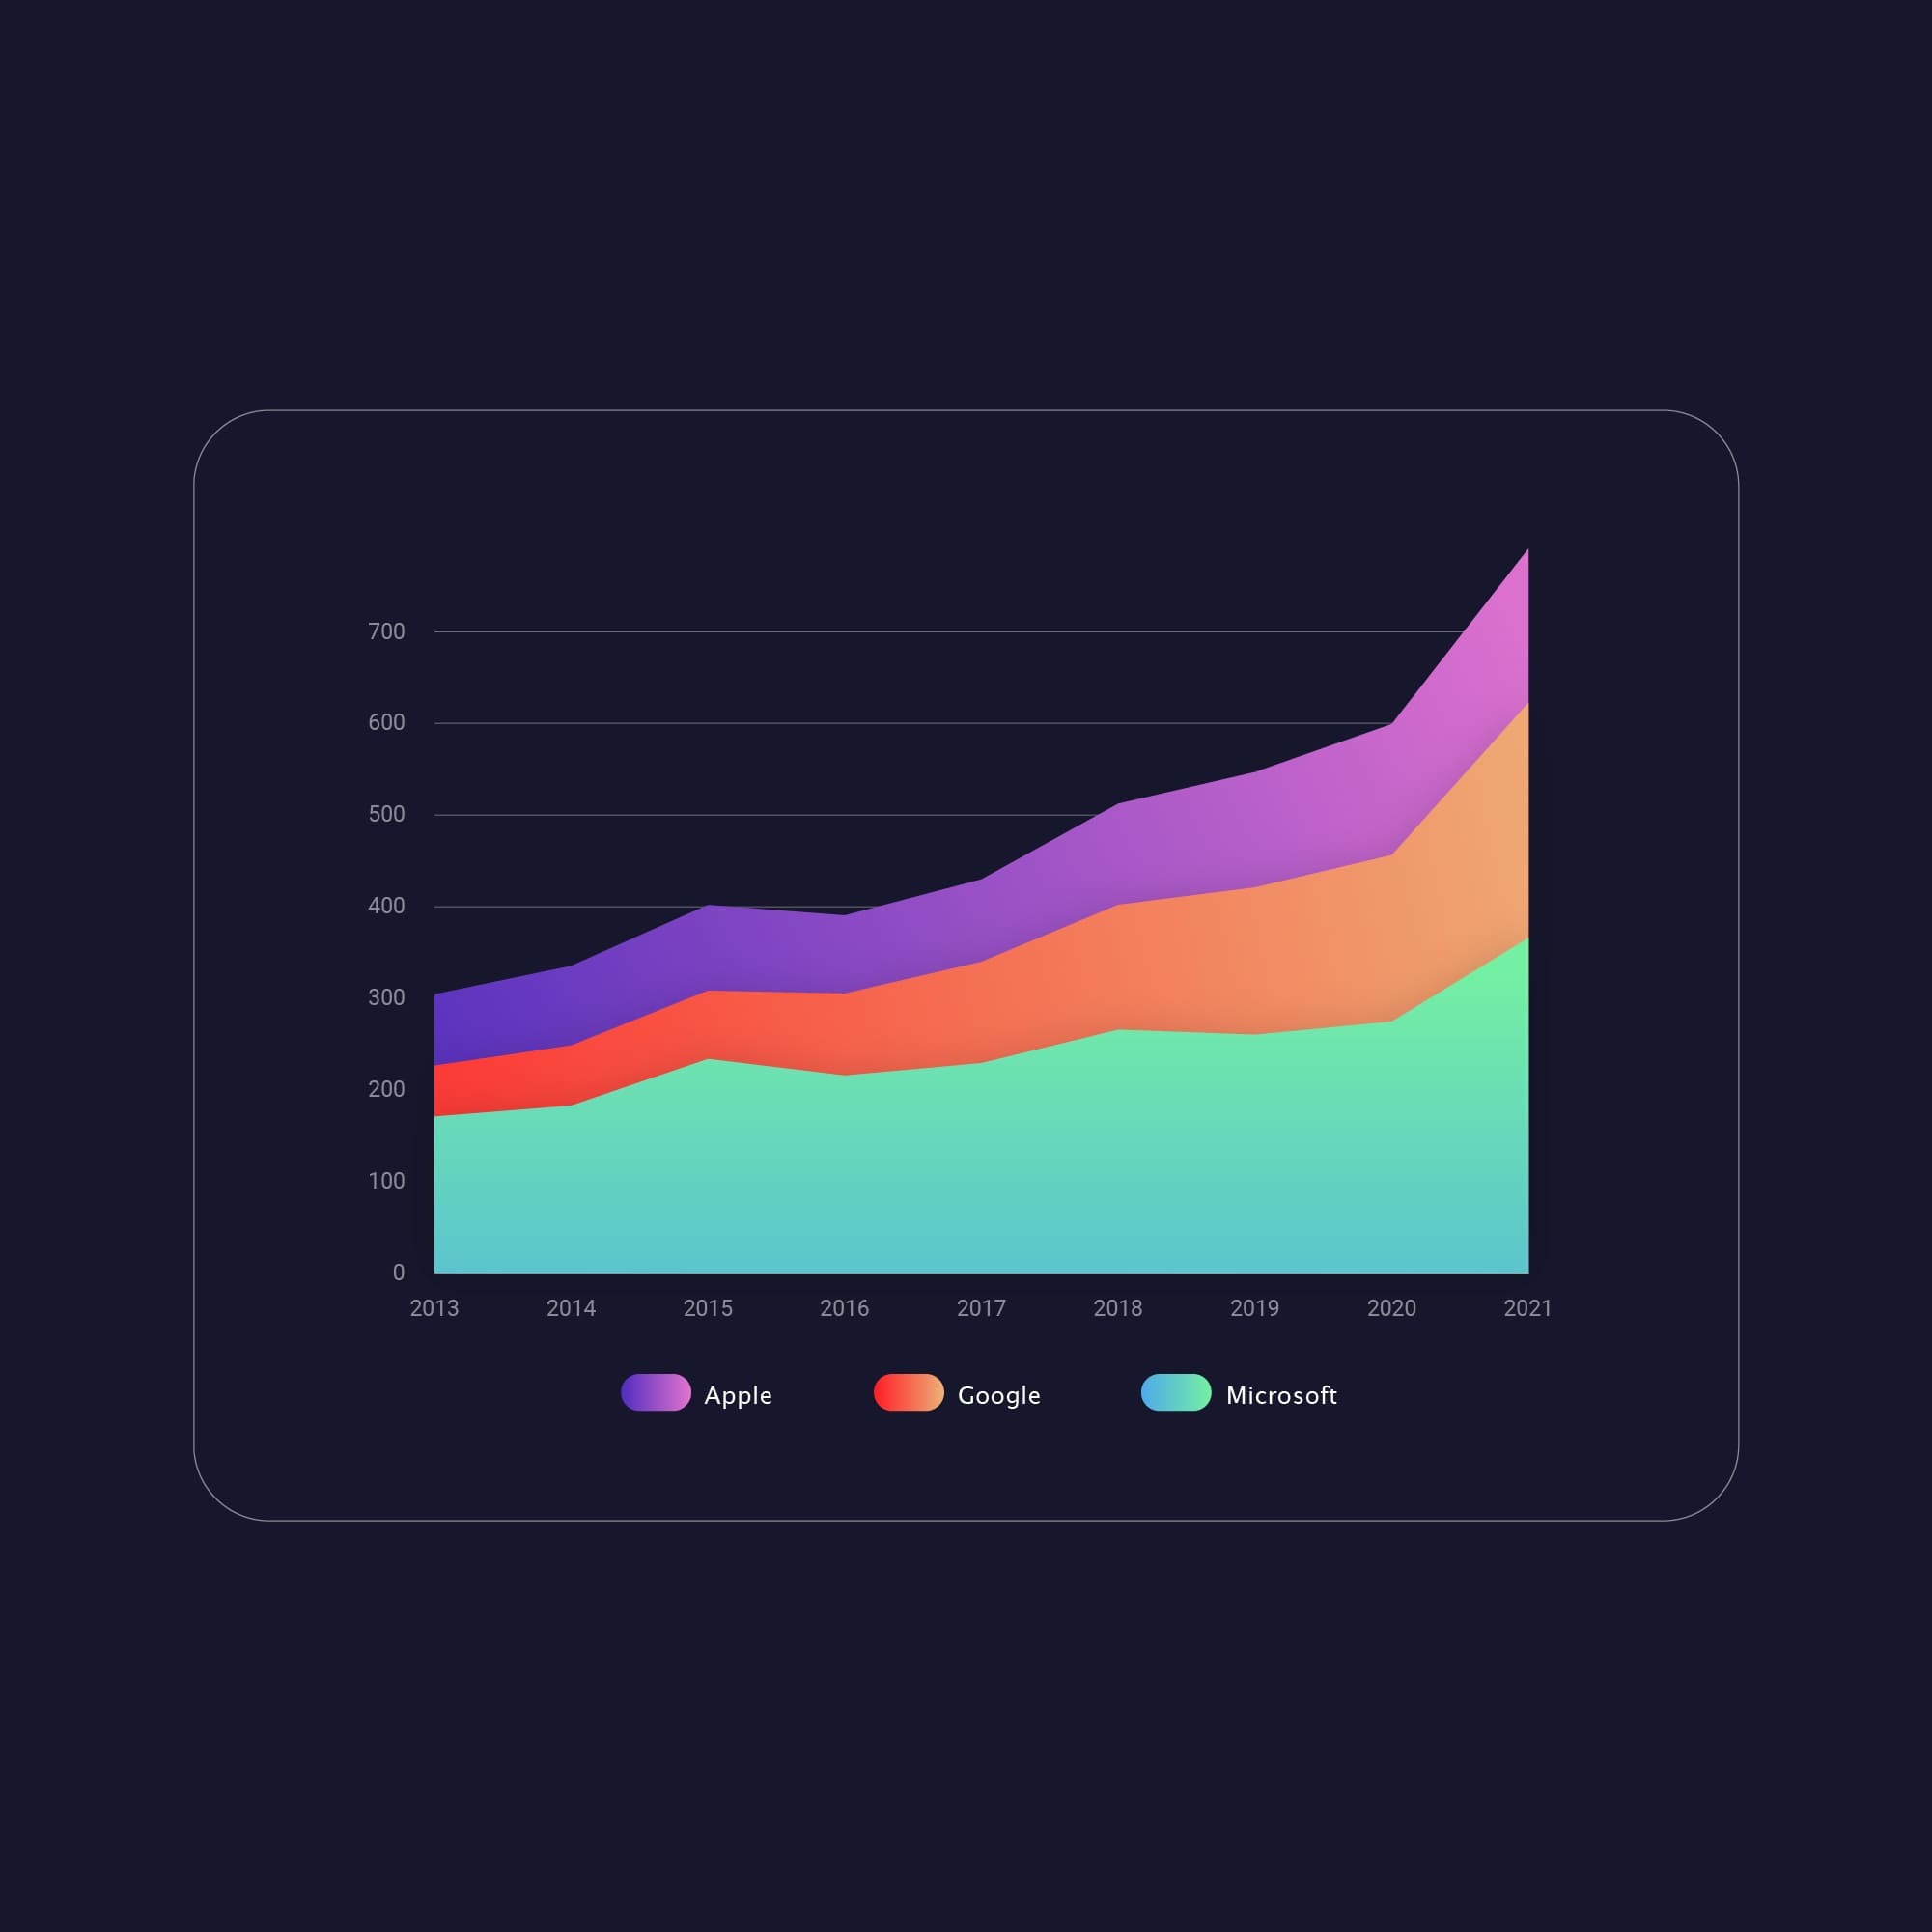
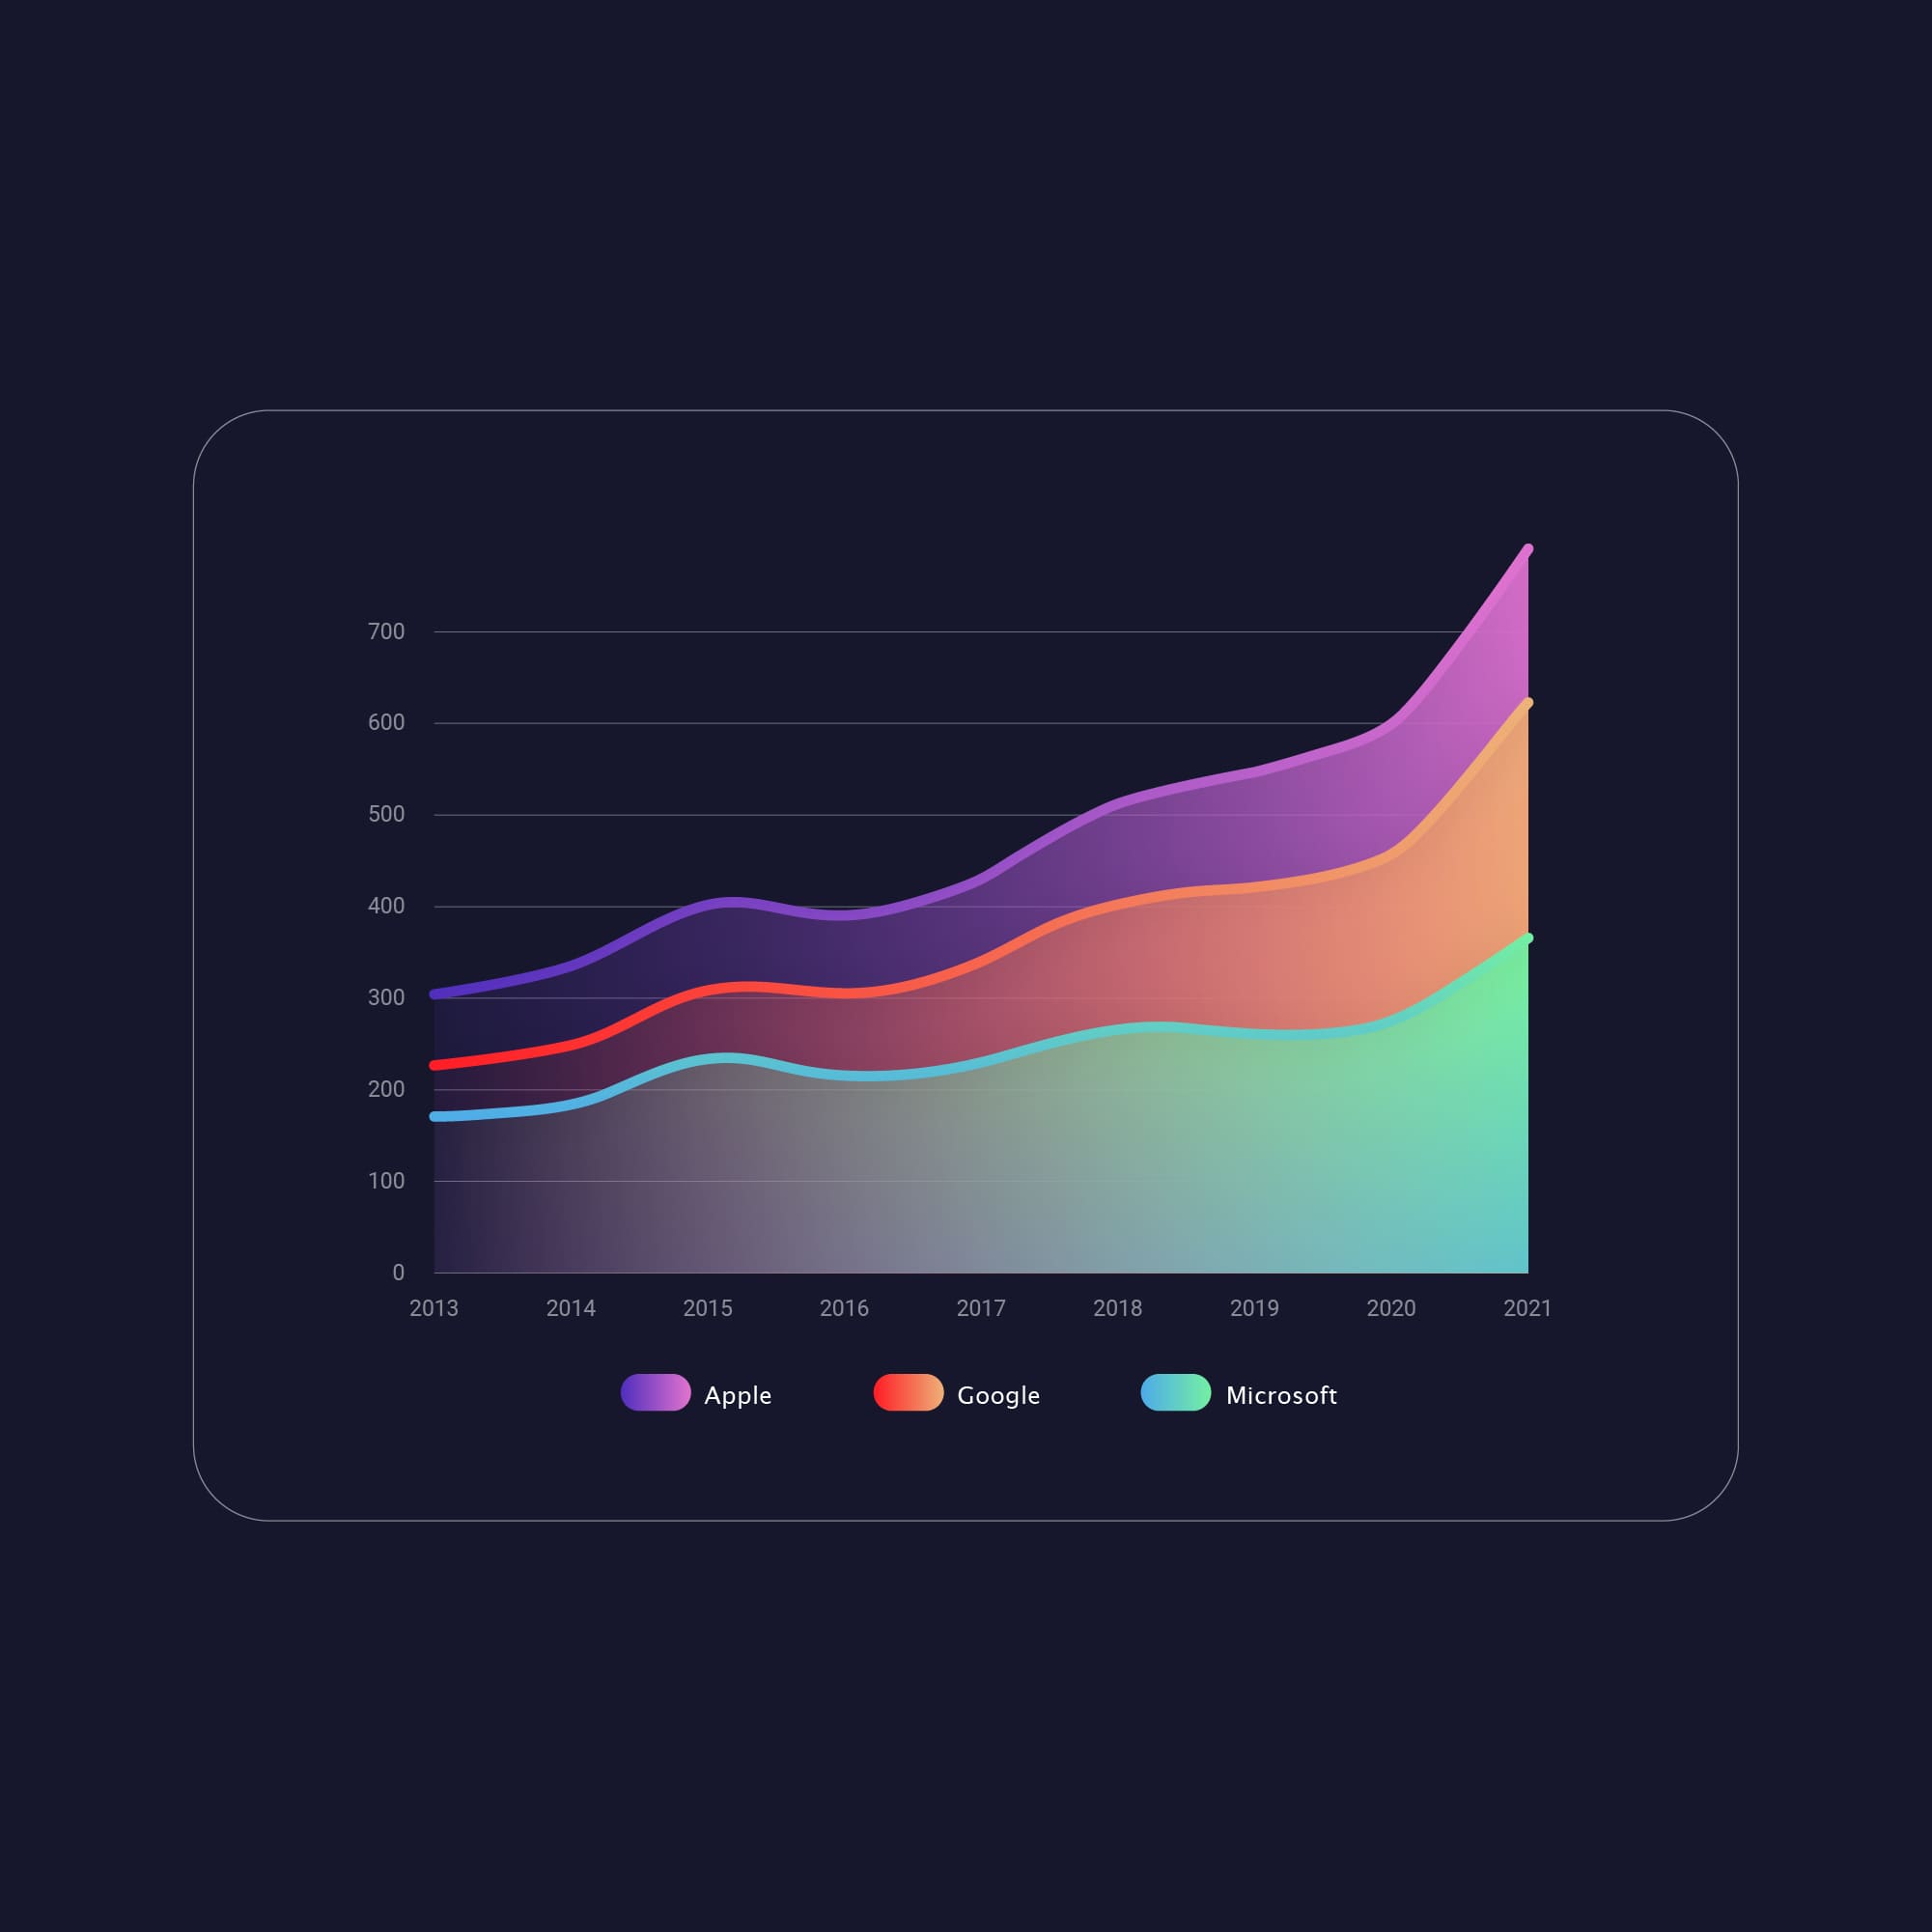
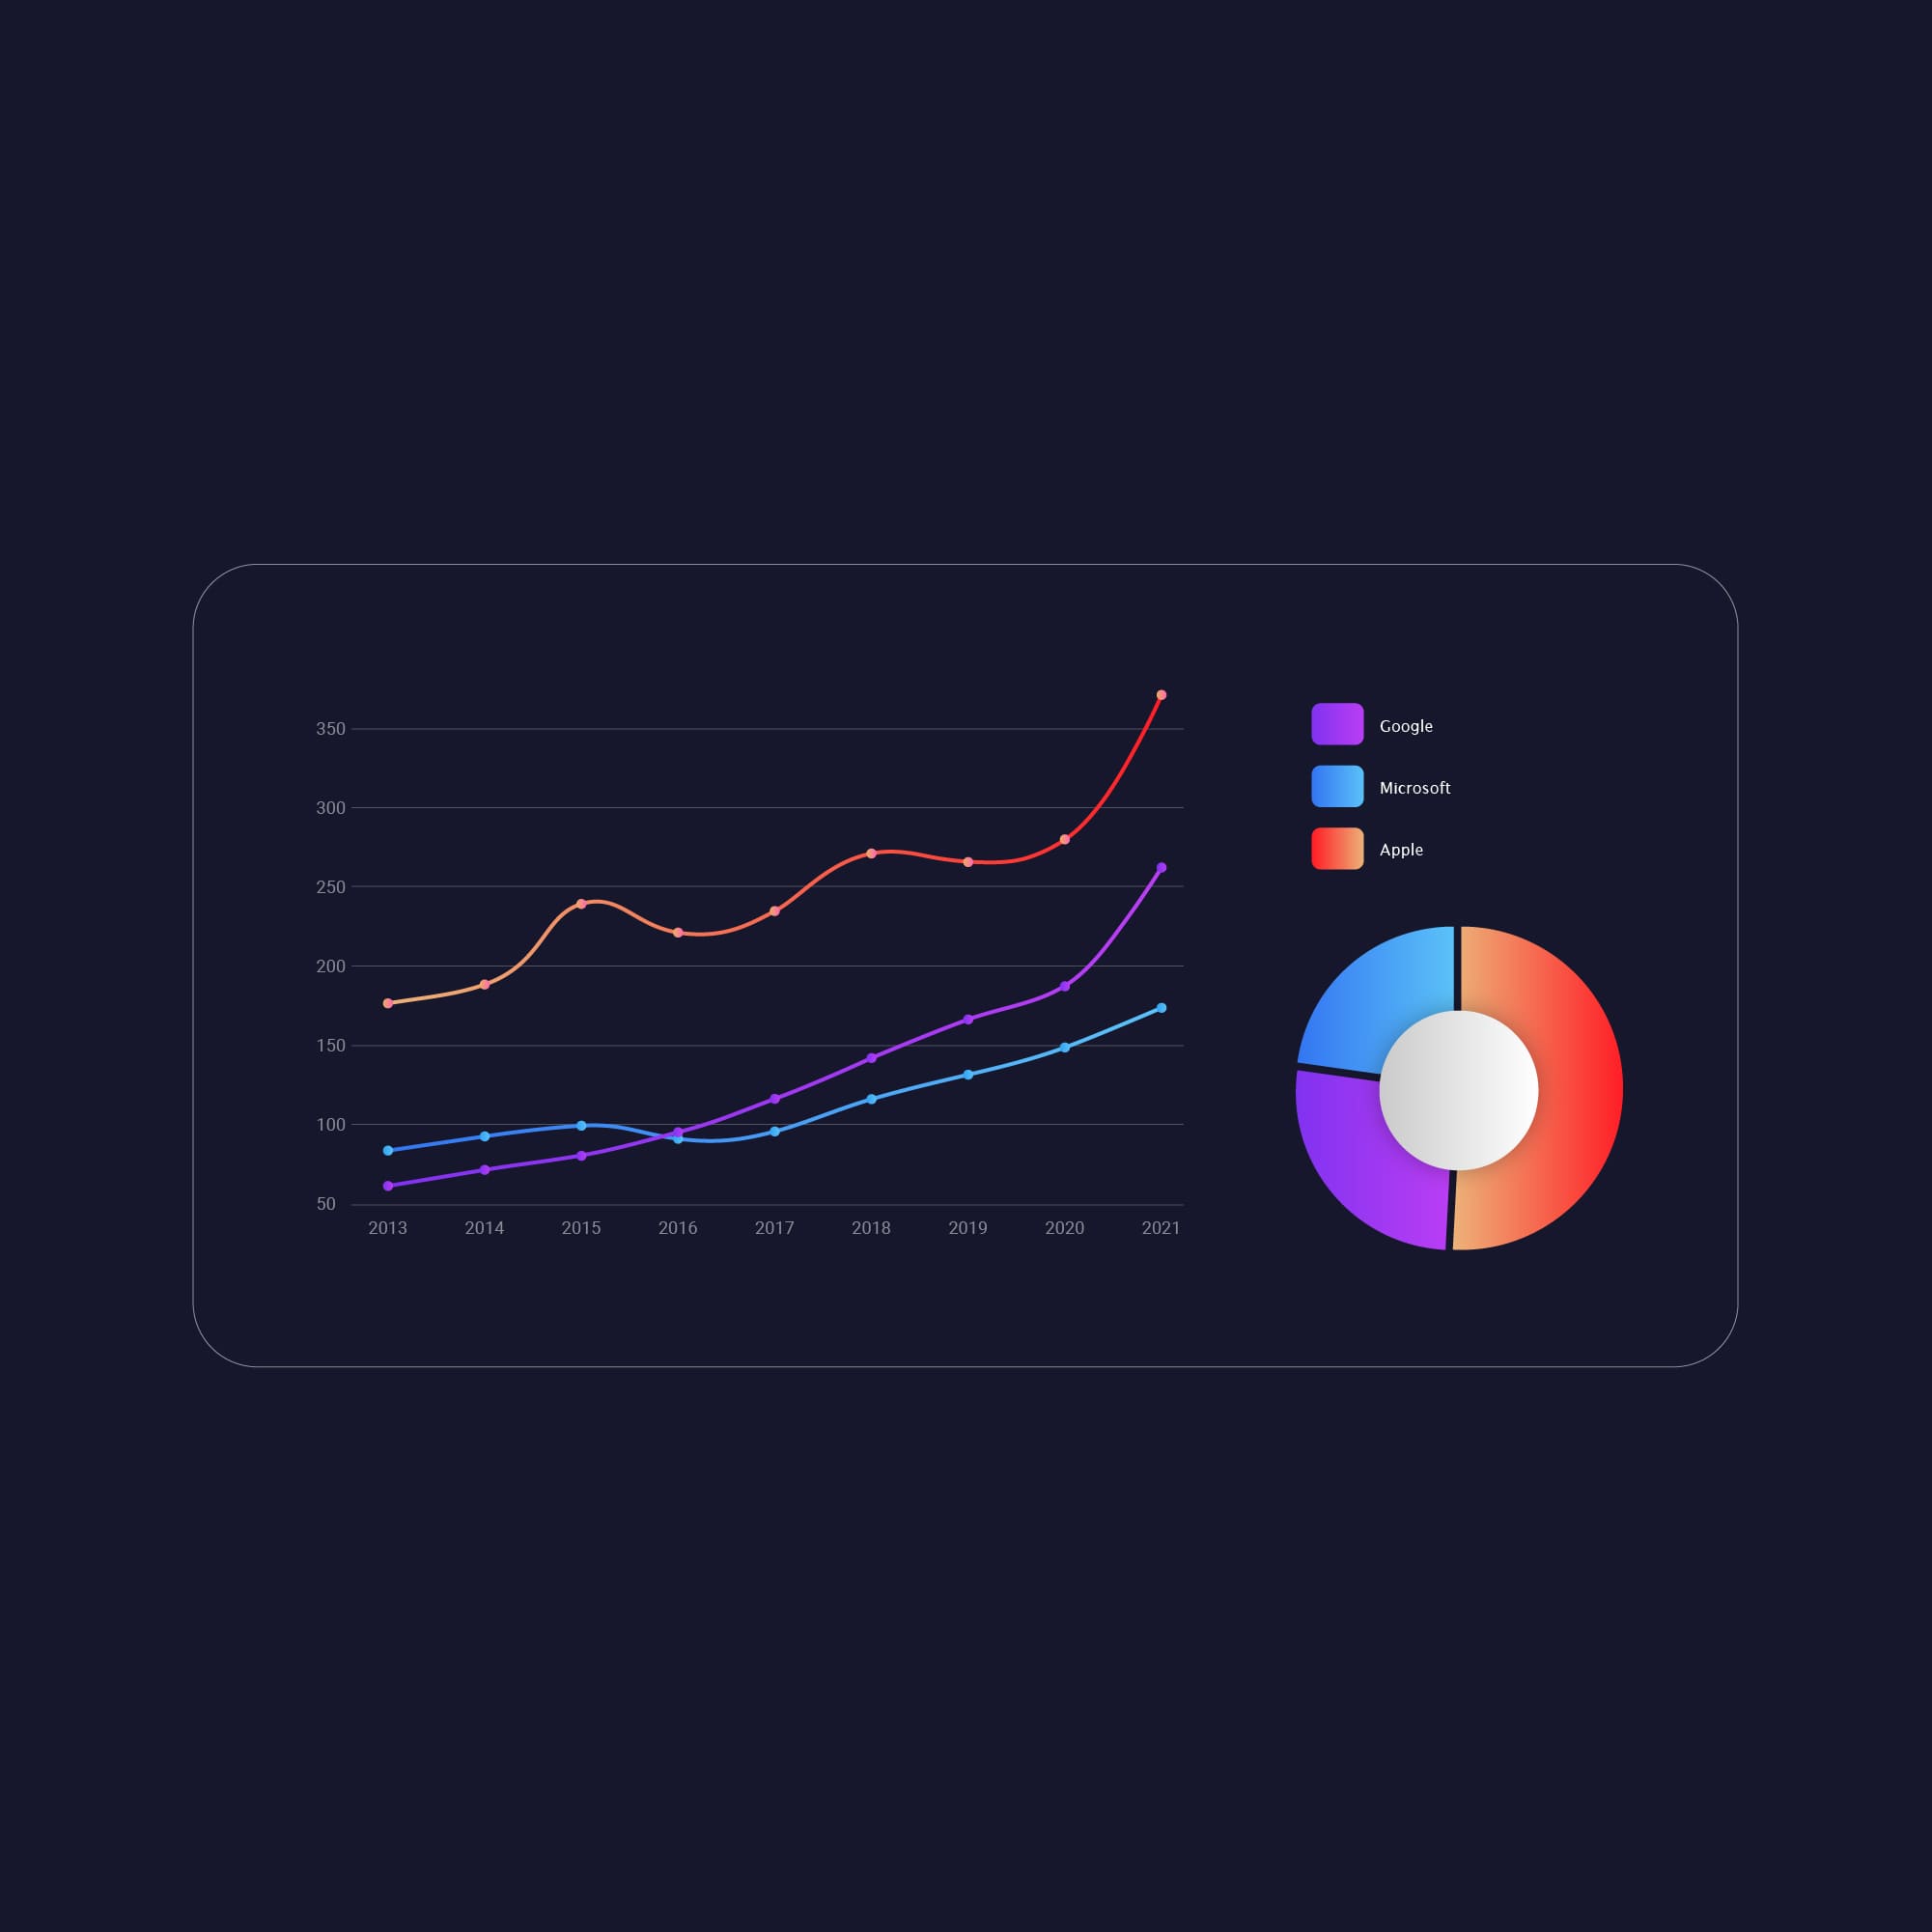
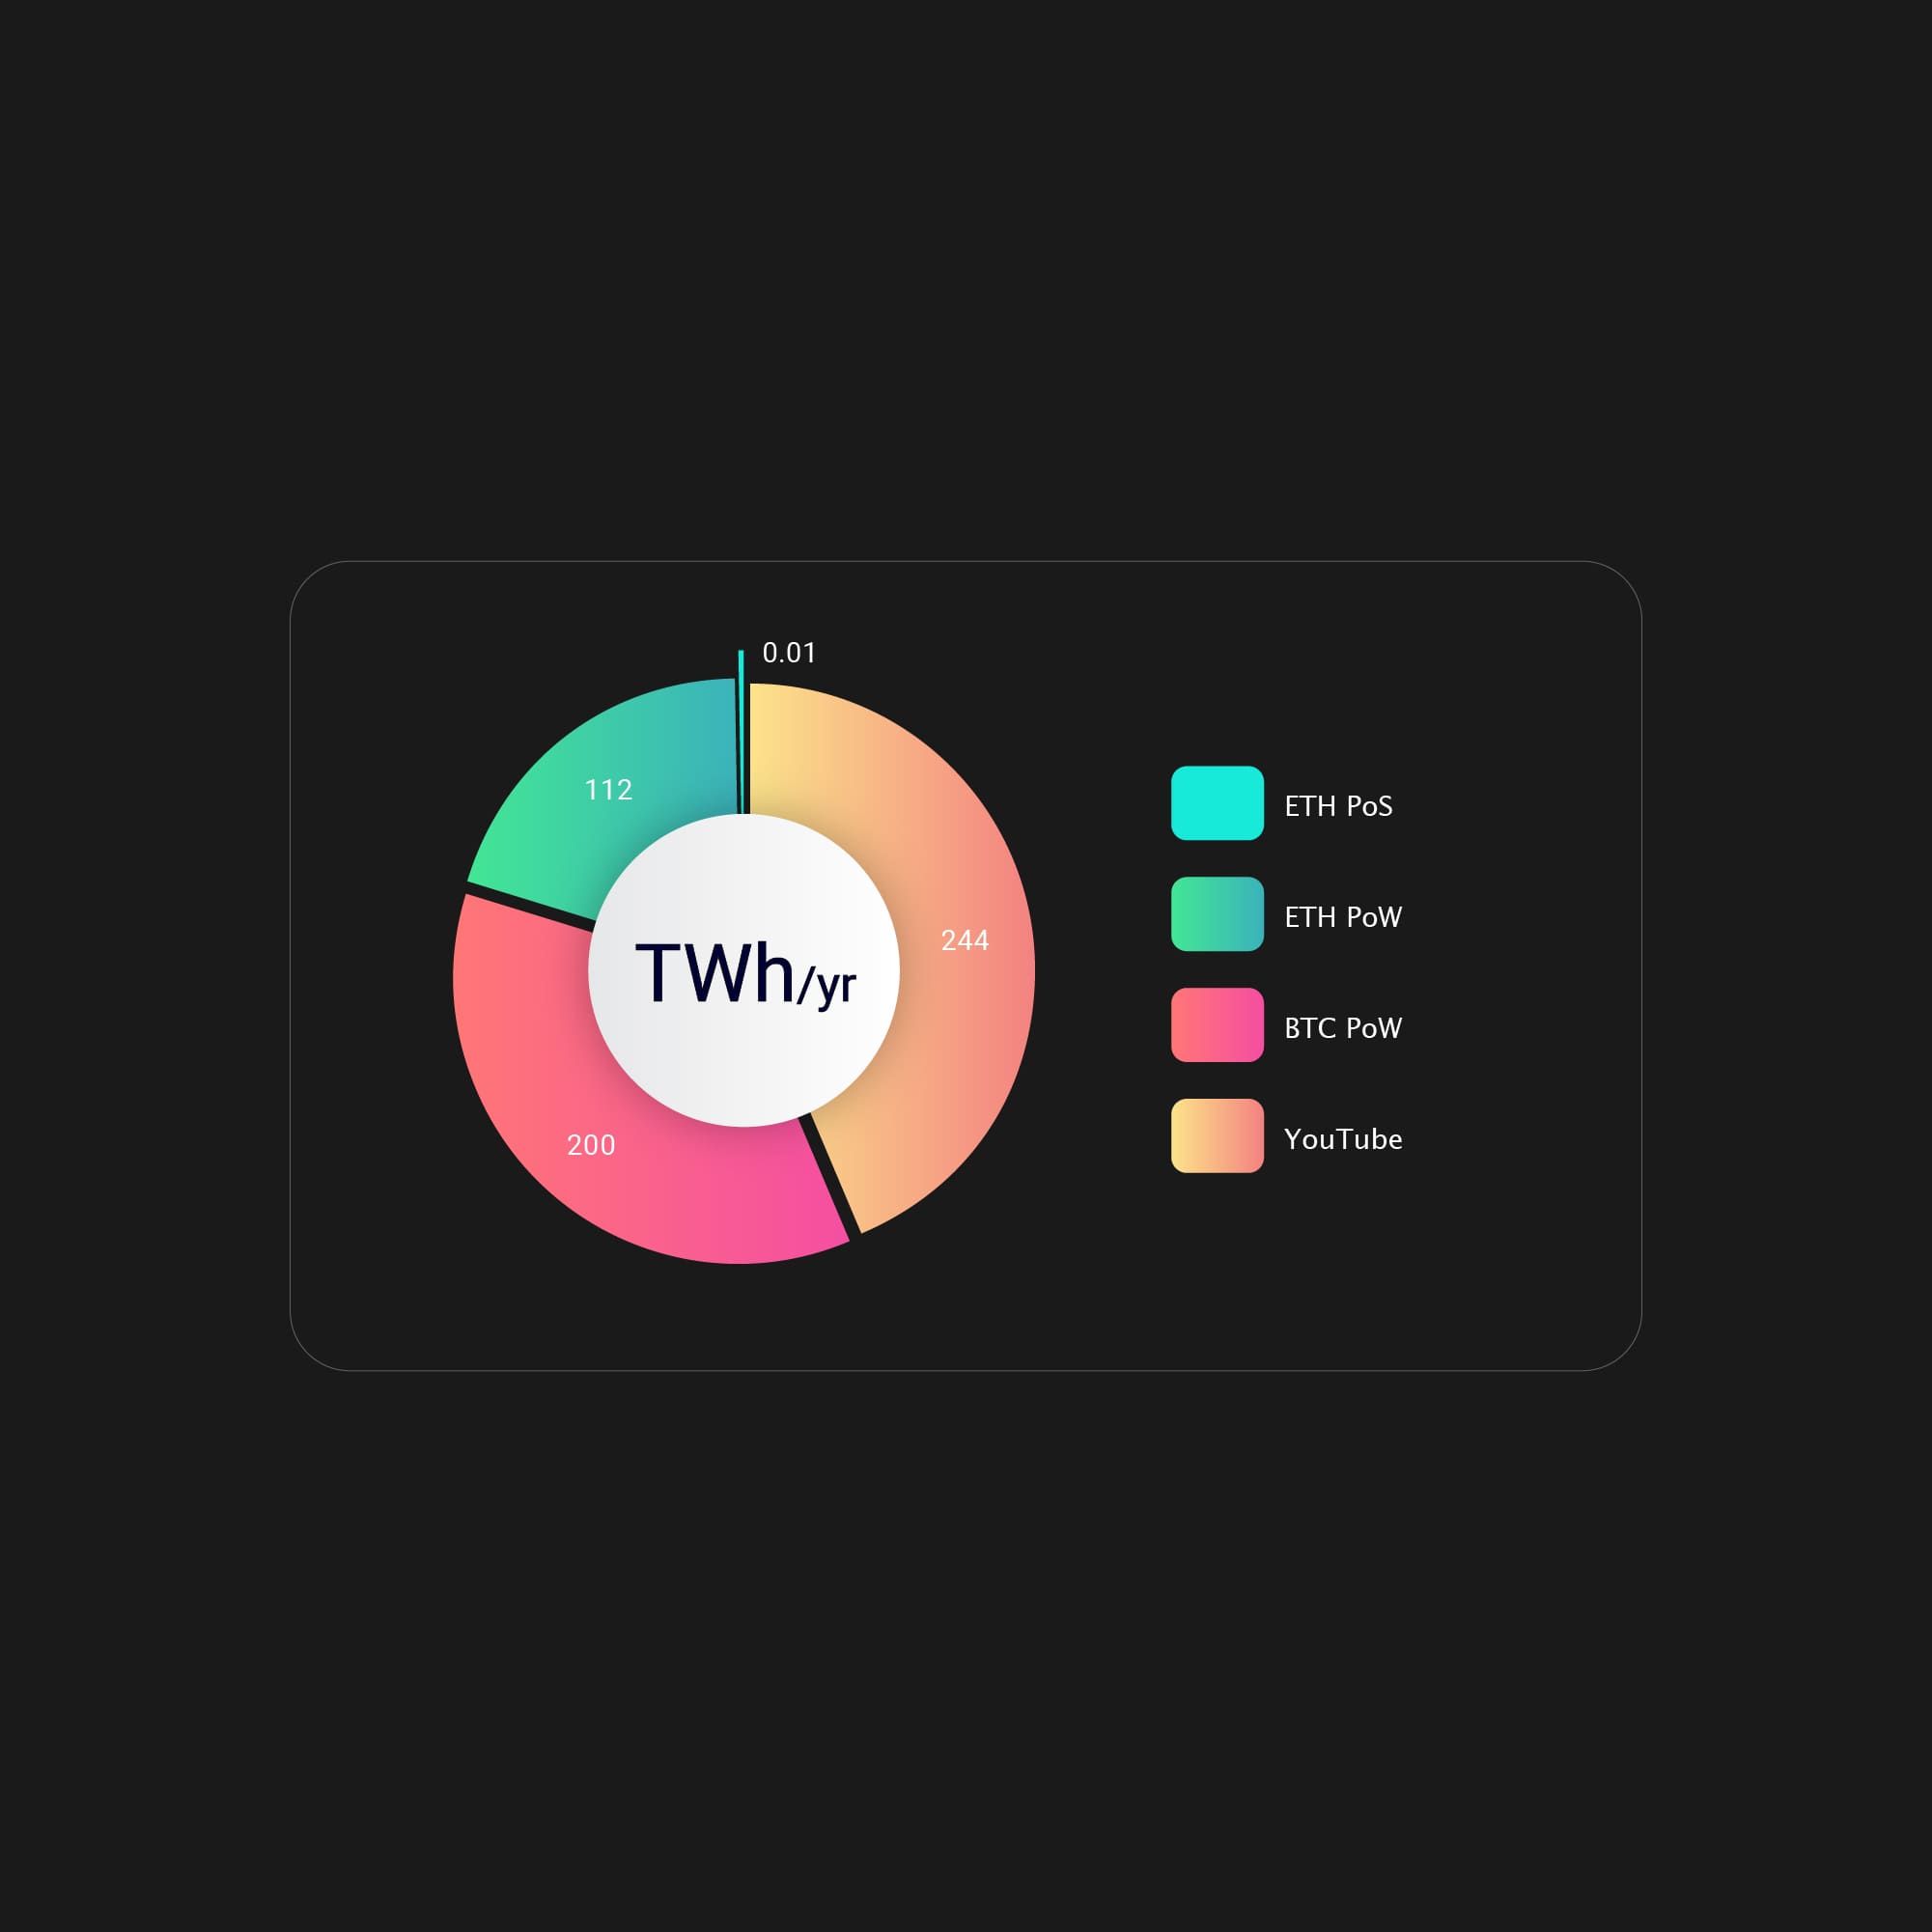
Charts created using real data and Adobe Illustrator tools.